Table Of Contents
Ingest Logs from On-Premises Windows Server to Microsoft Sentinel
In today’s digital landscape, security is a top priority for organizations of all sizes. One effective way to strengthen your security posture is through centralized log management and analysis. Microsoft Sentinel, a scalable and intelligent Security Information and Event Management (SIEM) solution, provides real-time monitoring and analysis of security events. In this post, I will walk you through the process of ingesting logs from an on-premises Windows Server to Microsoft Sentinel for analysis, which helps you detect and respond to threats efficiently.
Why Ingest Logs into Microsoft Sentinel?
Before diving into the technical steps, it’s important to understand why ingesting logs into Microsoft Sentinel is crucial:
- Centralized Monitoring: By aggregating logs from various sources, including your Windows servers, Microsoft Sentinel enables you to monitor and manage your security events in one place.
- Enhanced Threat Detection: Sentinel uses built-in machine learning models and analytics to detect potential threats and anomalies across your environment.
- Automated Responses: Sentinel allows you to create automated playbooks for swift incident response.
- Compliance and Auditing: Collecting logs helps organizations meet regulatory requirements and audit their systems for potential vulnerabilities or misconfigurations.
Prerequisite
Before you proceed with the steps, ensure your machine is onboarded to Azure Arc. Click here to learn how to onboard a Windows server to Azure using Azure Arc.
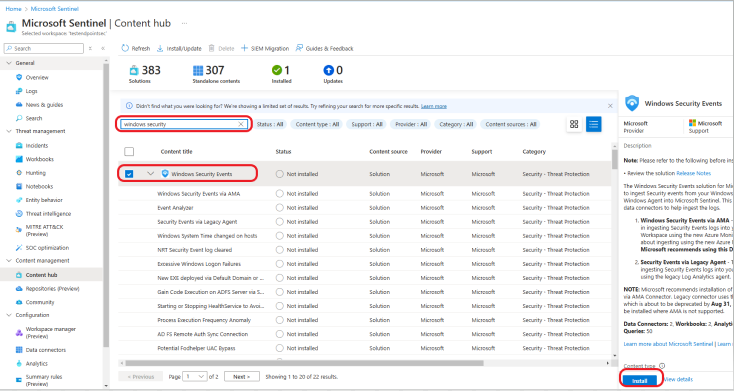
In Microsoft Sentinel, click on Content hub under the Content Management section and search for Windows Security Events via AMA. Press enter and click the Install button, as shown below.
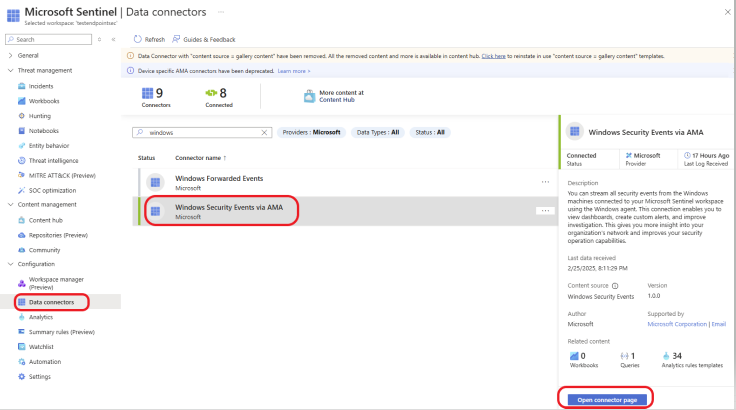
Click on Data connectors under the Configuration section and select Windows Security Events via AMA. Click on the Open Connector page, as shown below.
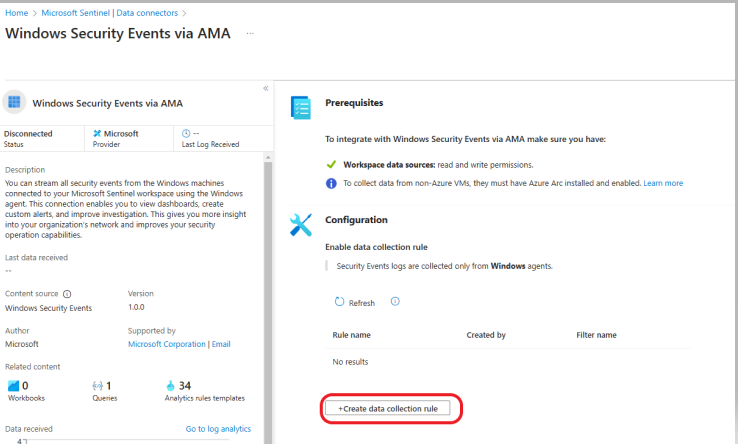
Click on + Create data collection rule.
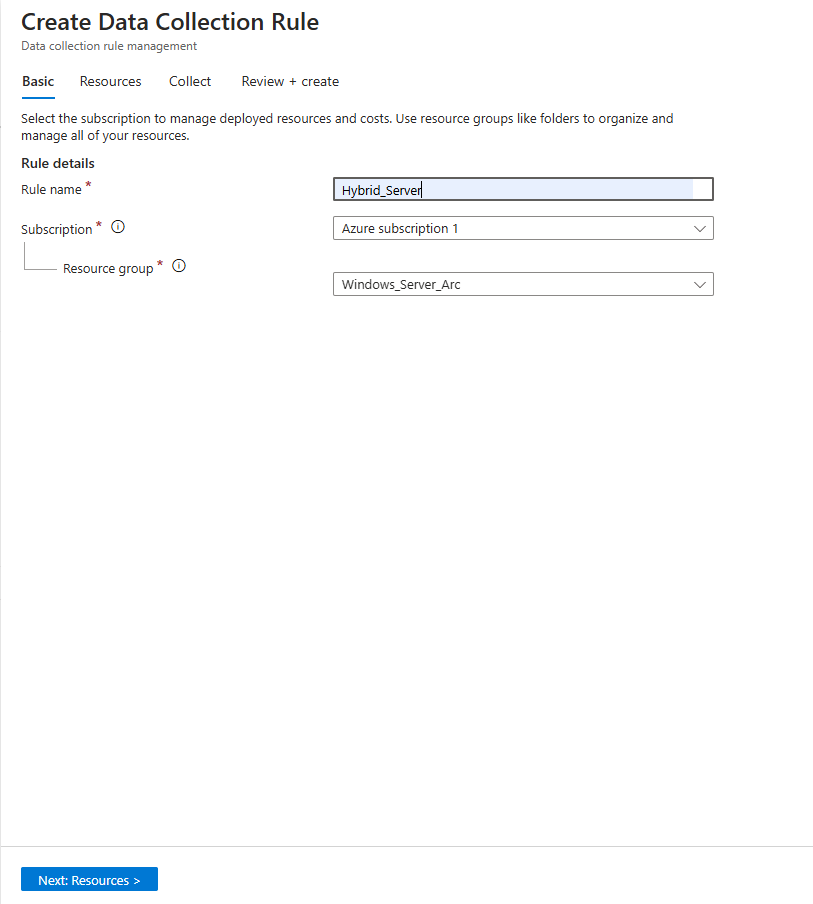
On the Basic tab, give your rule a name and select your Subscription and Resouce group, as shown below. Click on Next: Resources.
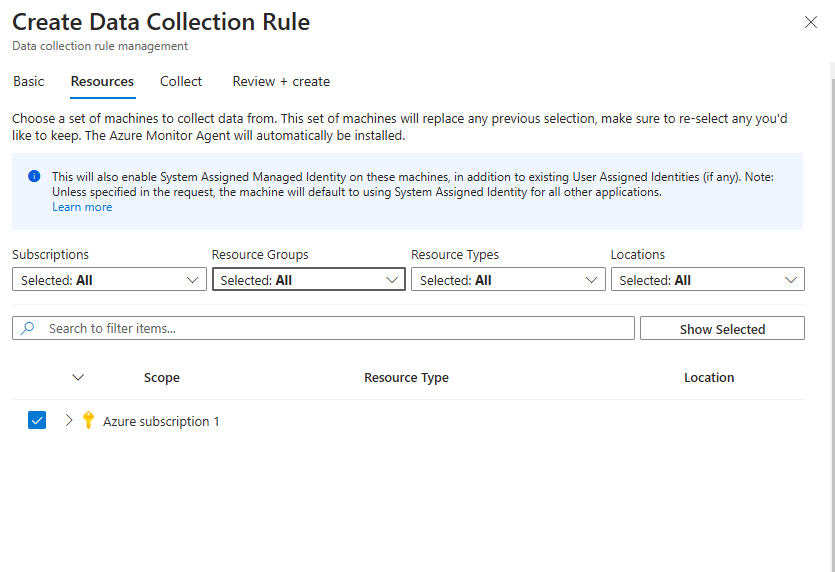
Click on the Resources tab at the top. Select the resource from which you would like to collect data.
Note: If you have multiple subscriptions, click the down arrow under the Subscriptions (Select: All) to select your subscription. Click on Resource Groups to specify a resource group. Specify your Resouce Types and Location. Click on Next: Collect >.
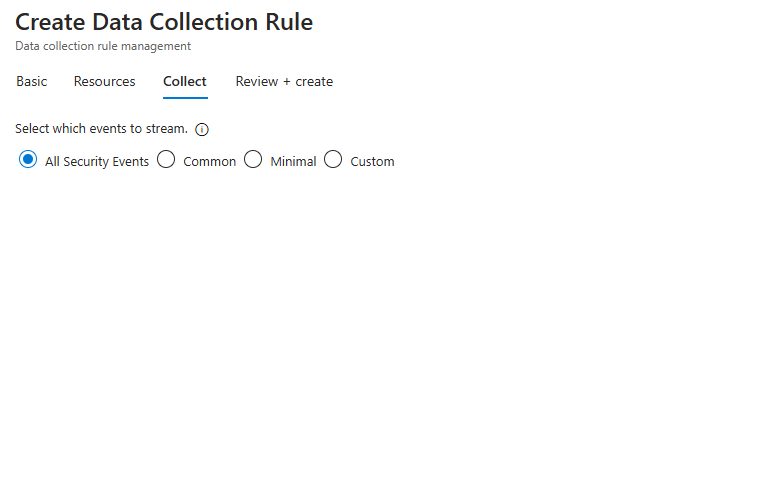
Select what events you would like to collect based on your organization’s needs. For this example, I will select All Security Events. Click on Next: Review + Create >.
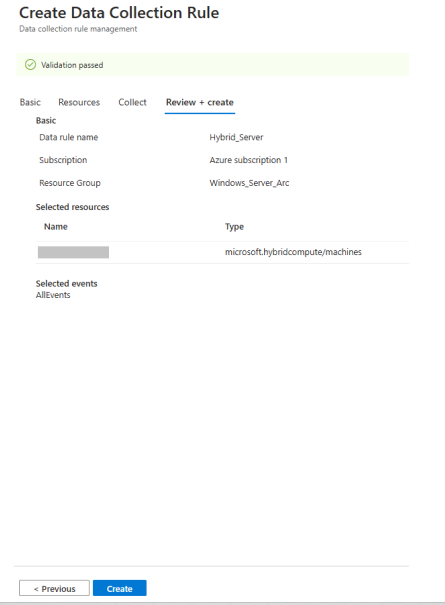
Review your rule and click on the Create button.
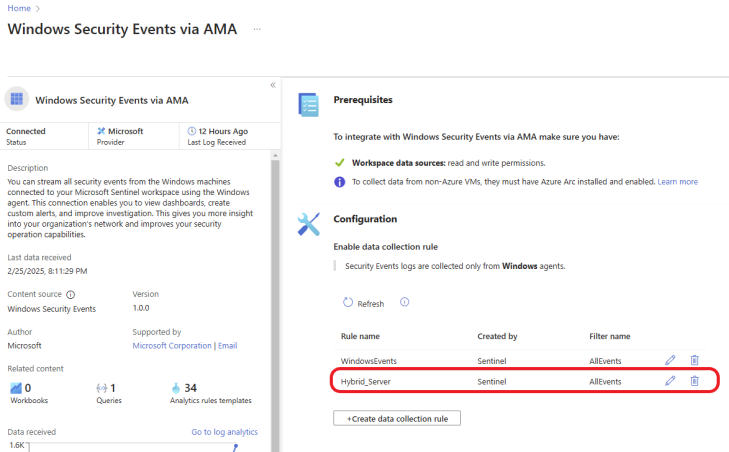
The rule was created successfully, as shown below.
Evaluate the Effectiveness of the Configuration
To evaluate the effectiveness of the log ingestion configuration, I am going to simulate a brute-force attack on the on-premises server.
First, make sure that your machine is configured to report account login events. Follow these steps if not configured already.
How to Configure Your Windows Server to Report Account Logon Events
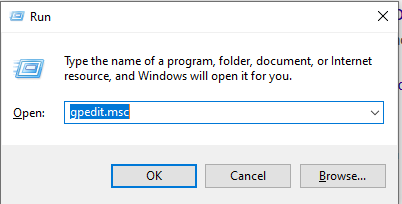
Press Windows Key + R and type gpedit.msc. Click Ok or press Enter.
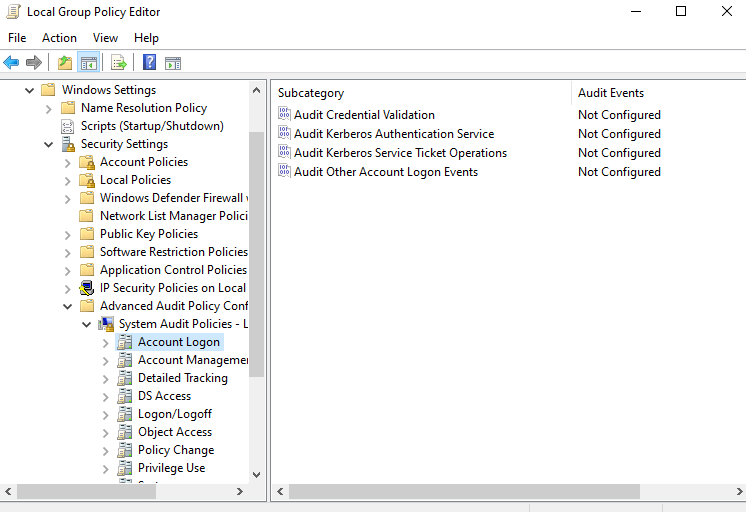
Windows Settings > Security Settings > Advanced Audit Policies > System Audit Policies > Account Logon. Double-click on Audit Credential Validation.
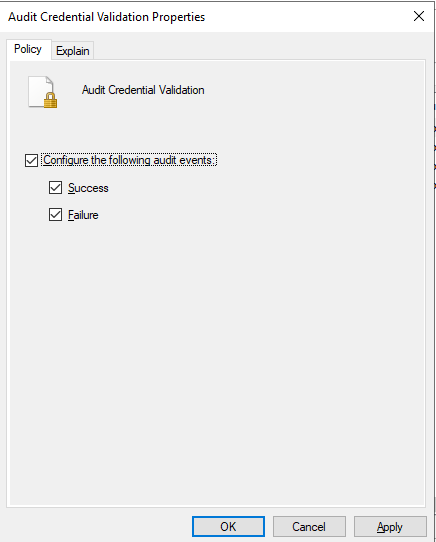
Check the box next to Configure the following audit events, and select Success and Failure. Click on Apply, and click on OK.
Next, on the target machine (on the premises Windows server), enter the wrong password multiple times.
Go to your Microsoft Sentinel workspace in the Azure portal. Click on Logs and run the Kusto Query Language (KQL) below to search for EventID 4776. EventID 4776 “The domain controller attempted to validate the credentials for an account.” You can also set up alerts and analytics rules to monitor specific events from your Windows Server logs. You can configure custom rules or use out-of-the-box templates to detect common attack patterns or anomalies.
SecurityEvent
| where EventID == 4776
Notice that logs have started coming in, as shown below. Click on Columns on the right side to filter and select what information you want to see on your dashboard.

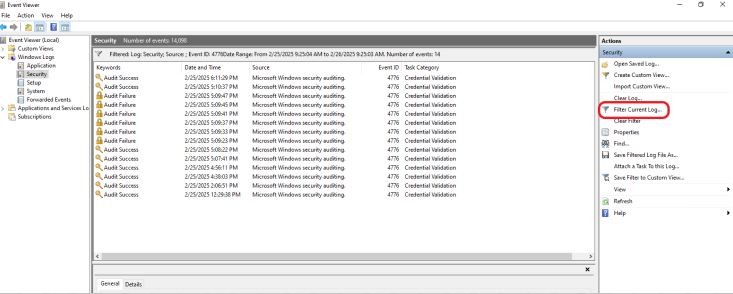
Now, let’s compare the logs in Microsoft Sentinel with the generated logs on the target machine. Log in to your target machine, open the Event Viewer, and click on Security on the left side. Click on Filter Current Logs on the right side to filter and select what information you want to see on your dashboard, as shown below.
Conclusion
Ingesting logs from your on-premises Windows Server into Microsoft Sentinel is an essential step toward improving your organization’s security posture. By following the above steps, you can collect, monitor, and analyze security data in a centralized environment, enabling faster threat detection and response. With the power of Microsoft Sentinel’s analytics and automation, your team can stay ahead of potential security risks and ensure the security of your infrastructure. Don’t forget to continuously review and refine your log collection strategies to ensure you’re capturing the most relevant security data for your environment. As threats evolve, so should your security monitoring and incident response strategies.
