Table Of Contents
- 1 Steps to Create a Honeypot in Azure and Integrate with Microsoft Sentinel
- 2 What is a Honeypot and Why Use It?
- 3 Why Integrate Azure Honeypots with Microsoft Sentinel?
- 4 Set Up an Azure Virtual Machine (VM) for the Honeypot
- 5 Configure Microsoft Sentinel
- 6 Connect Azure Virtual Machines to Sentinel
- 7 Run Queries and Schedule Alert Rules in Microsoft Sentinel
- 8 Conclusion
- 9 About The Author
Steps to Create a Honeypot in Azure and Integrate with Microsoft Sentinel
As cyber threats continue to evolve, organizations are seeking advanced ways to detect and mitigate attacks before they escalate. One effective and proactive security measure is the deployment of a honeypot. A honeypot is a decoy system designed to attract attackers and capture valuable threat intelligence. In this post, I will guide you through creating a honeypot in Microsoft Azure and utilizing Microsoft Sentinel to monitor and analyze attacker activity.
What is a Honeypot and Why Use It?
A honeypot is a security resource designed to deceive cybercriminals by mimicking real, vulnerable systems. When attackers attempt to exploit these decoy systems, security teams can capture detailed logs of the intrusions, helping to identify attack techniques and better prepare defenses.
In Azure, creating a honeypot provides a low-cost, scalable environment for monitoring malicious activity without risking your critical infrastructure. By pairing your honeypot with Microsoft Sentinel, Azure’s cloud-native SIEM (Security Information and Event Management) solution, you can gain powerful insights into your environment, detect patterns of attacker behavior, and respond to threats faster.
Why Integrate Azure Honeypots with Microsoft Sentinel?
- Proactive Threat Hunting: With Sentinel’s query capabilities, security teams can actively search for attack indicators within honeypot logs to identify emerging threats.
- Comprehensive Monitoring: Sentinel offers advanced analytics and machine learning to detect anomalous behavior, providing deeper insights into your honeypot’s activities.
- Automated Threat Detection: Sentinel automates detection and alerting, reducing manual intervention and speeding up response times.
- Centralized Log Management: Sentinel collects, analyzes, and visualizes log data, allowing you to better understand potential threats targeting your honeypot.
In this section, I will walk you through setting up a honeypot in Azure and configuring Microsoft Sentinel to monitor attacker activity.
Set Up an Azure Virtual Machine (VM) for the Honeypot
The first step in creating a honeypot is to deploy an Azure Virtual Machine (VM) that will simulate a vulnerable system.
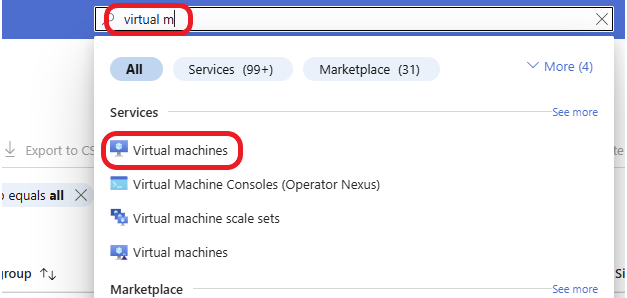
Log in to the Azure Portal with your admin credentials. In Azure, type virtual machine into the search box and click on Virtual Machine in the list.
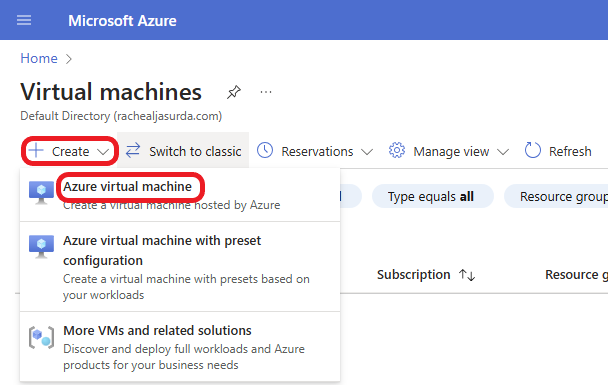
Click on + Create and select Azure virtual machine.
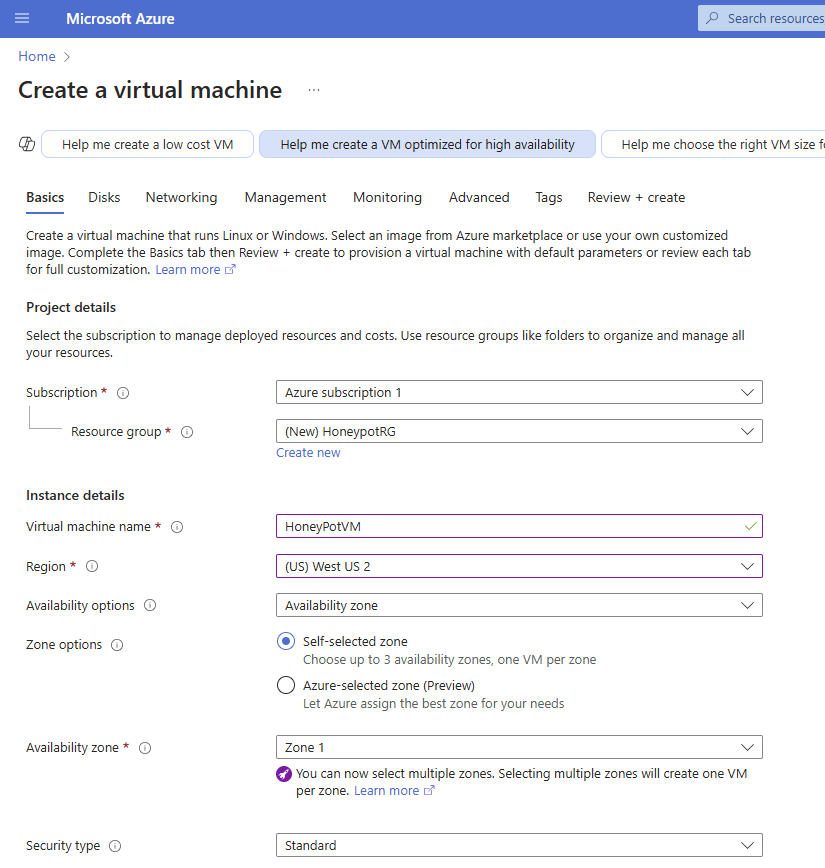
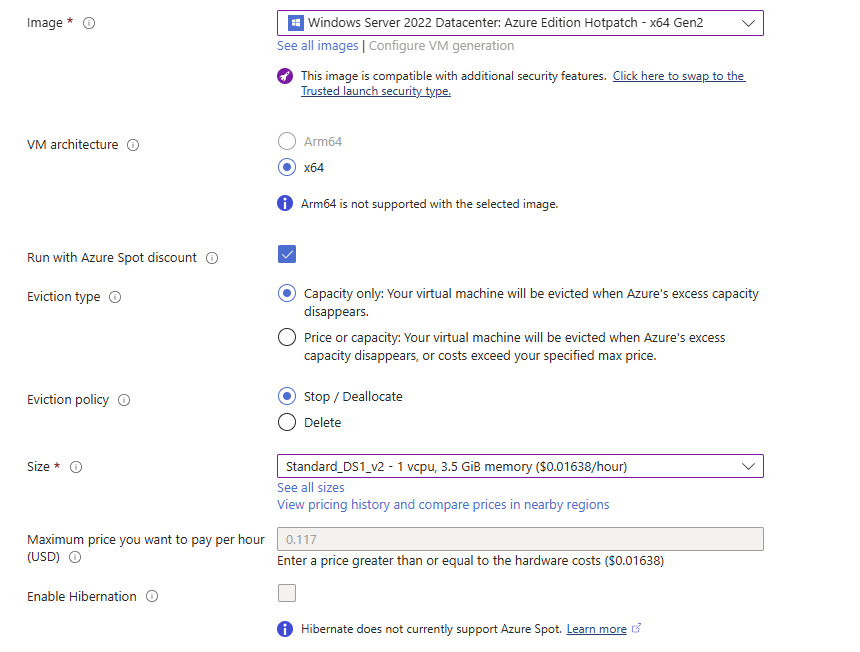
Select your Azure subscription, and select or create a new Resource group. Give your virtual machine a Name, select a Region, and select the desired Operating System (either Linux or Windows) for your honeypot. For example, you can choose Ubuntu if you’re creating a Linux-based honeypot. I am going to select the Windows Server image for this example. Choose a VM Size that is appropriate for your requirements. For a simple honeypot, a smaller VM size should suffice.
Create a username and password to log in to your VM. Select Allow selected ports for Public inbound ports, and choose RDP 3389 for Select inbound ports to enable RDP on port 3389.
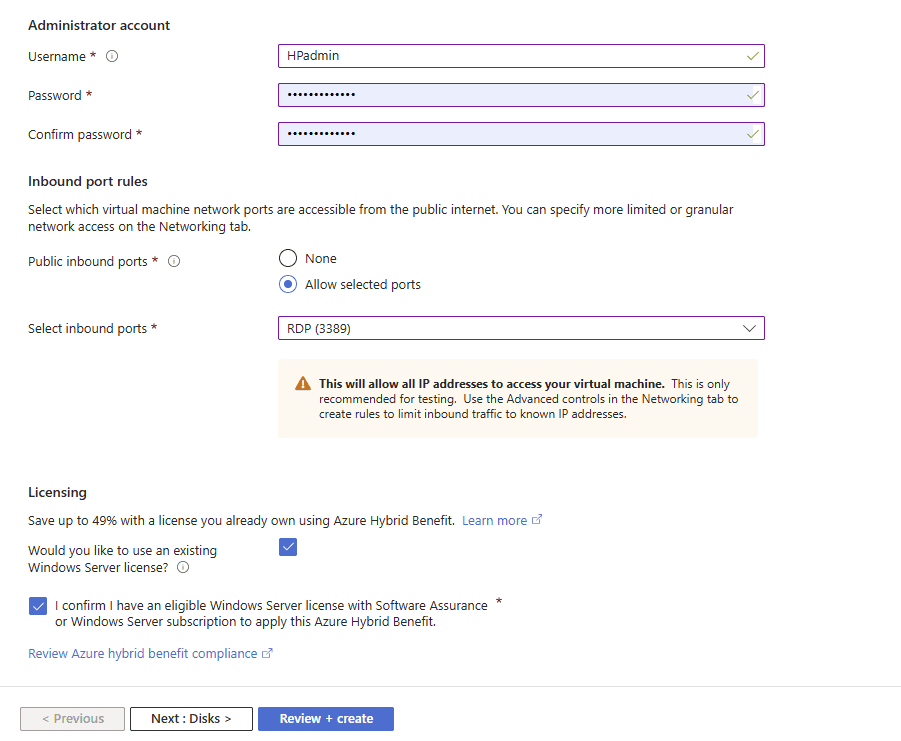
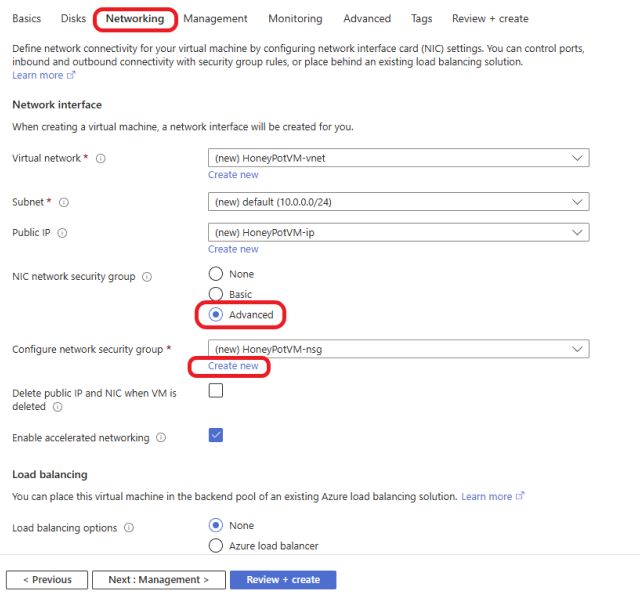
Click on the Networking tab, select Advanced, and click on Create new to create a new Network Security Group (NSG).
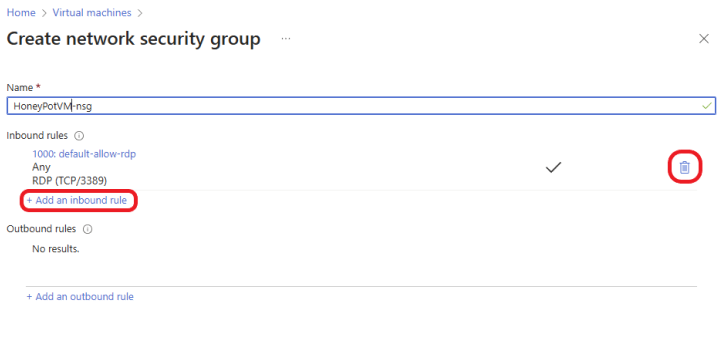
Delete the 1000: default-allow-rdp rule and click on +Add an inbound rule, as shown below.
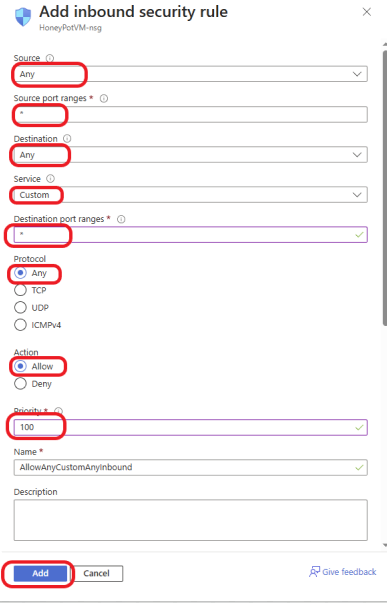
This is a honeypot VM, so we need to make it vulnerable to unauthorized access by exposing the VM to the internet. Allowing any port, protocol, source, and destination, as listed below.
- Source: select Any
- Source port range: put an asterisk
- Destination: select Any
- Service: Select Custom
- Destination port ranges: put an asterisk
- Action: select Allow
- Priority: type in 100
Click Add to add the rule.
The Network Security Group rule was successfully created. Click on OK.
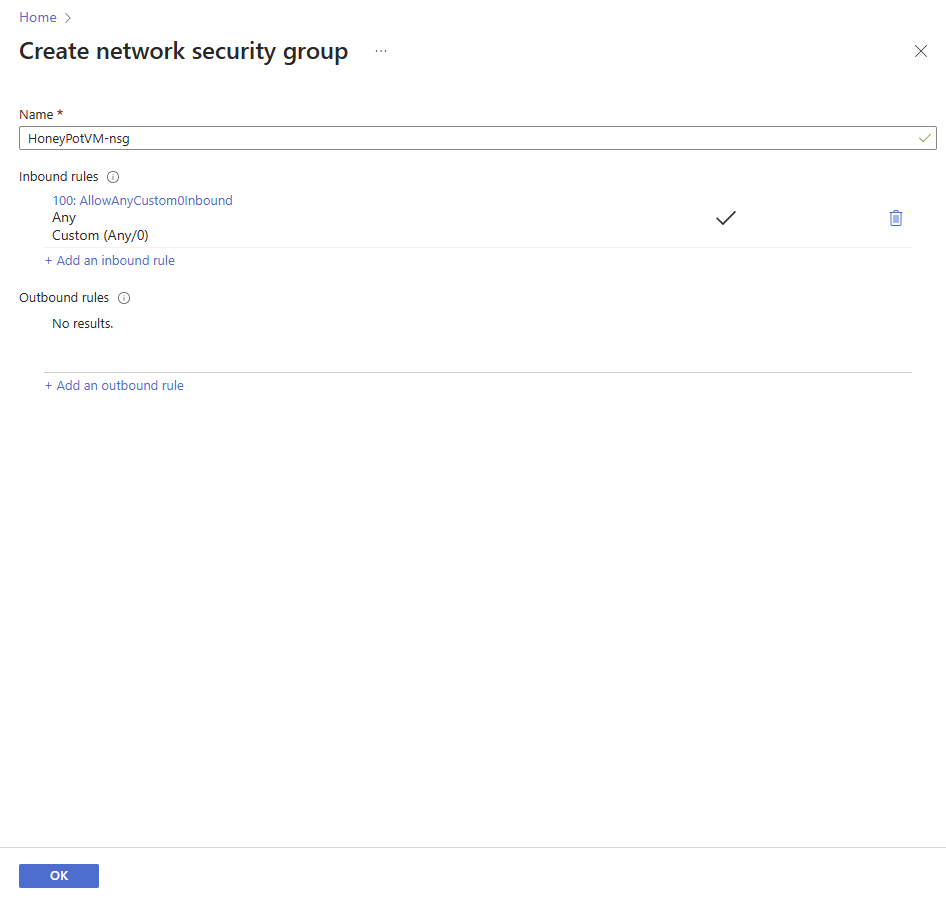
Click on Review + create.
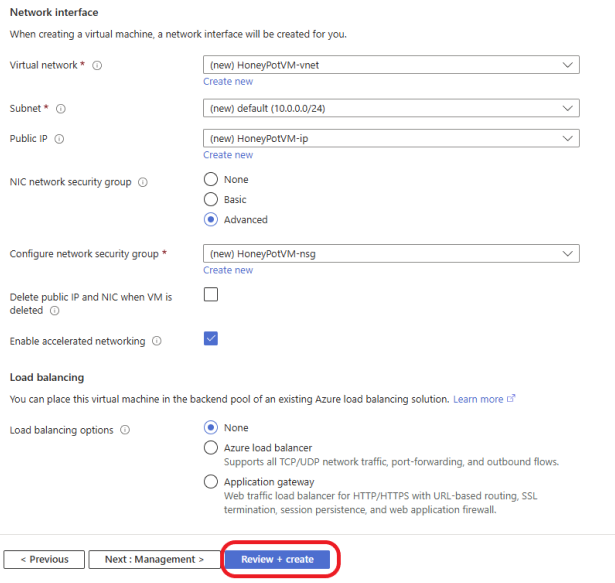
Review and make sure it meets your requirements. Click on the Create button to create the Virtual Machine.
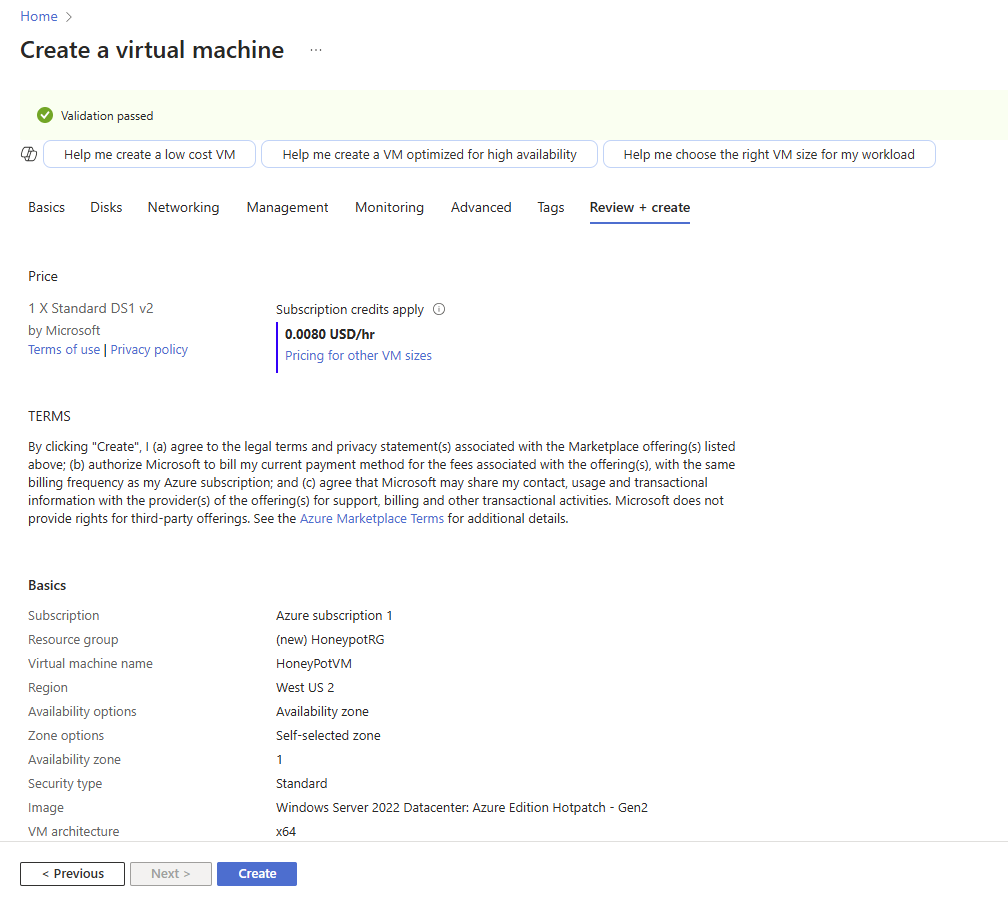
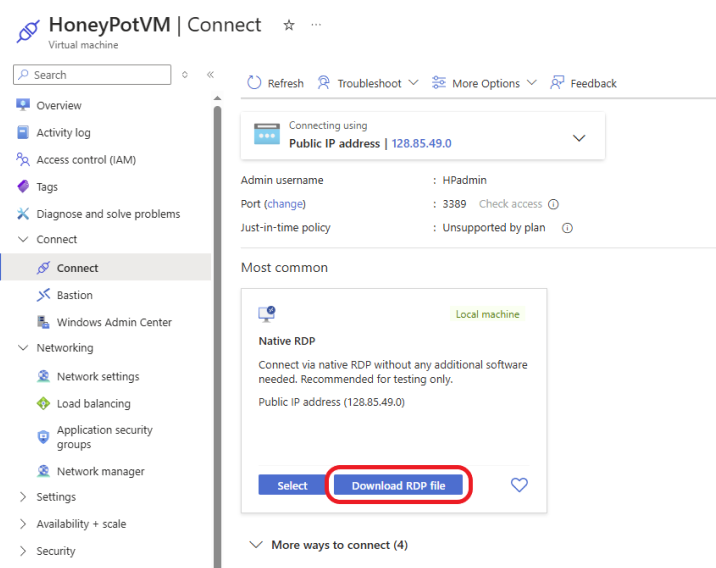
The VM was deployed successfully and is running. To log in to the VM, click on Connect and select Connect.
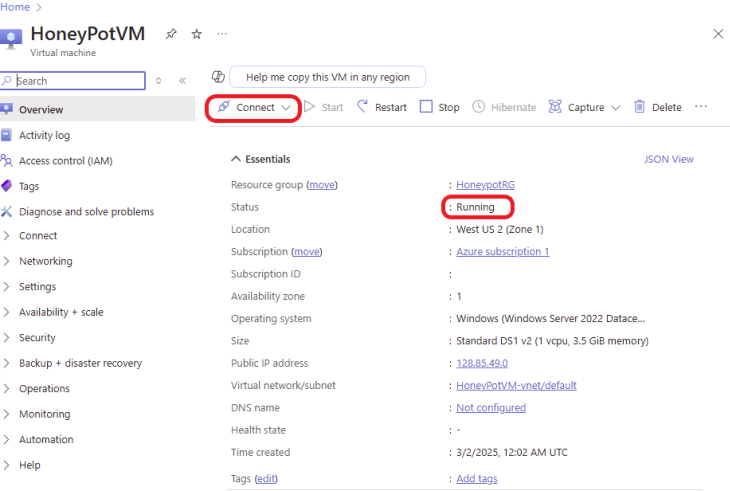
Click on Download RDP file
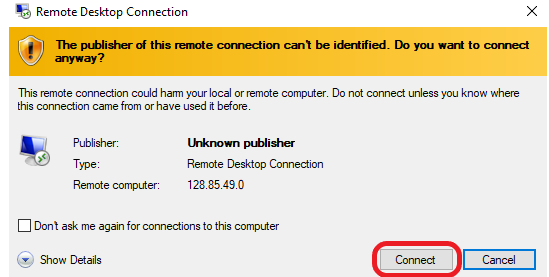
Click on Connect, enter your password, and log in.
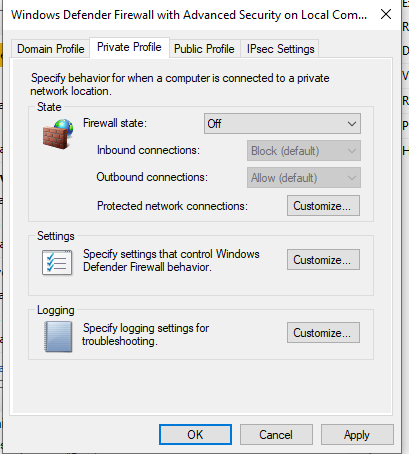
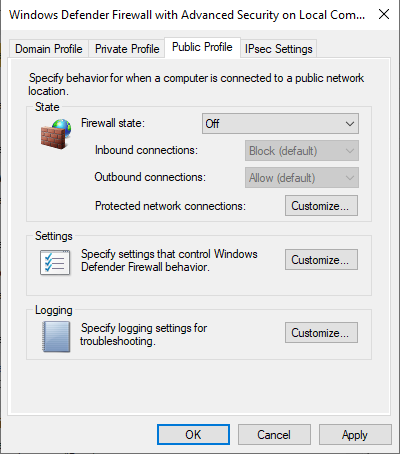
Once you log in to your VM, turn Windows Defender Firewall off to make the machine vulnerable, as shown below.
Configure Microsoft Sentinel
Once your honeypot is running, the next step is to set up Microsoft Sentinel to monitor and analyze the activities.
In the Azure portal, search for Microsoft Sentinel in the search bar and select it from the list.
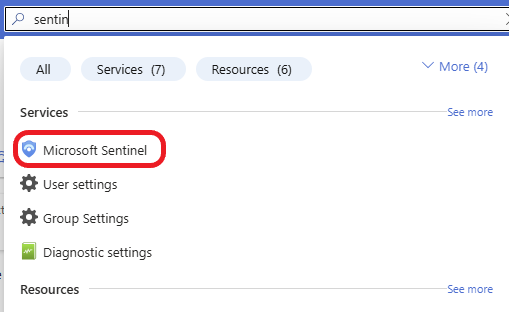
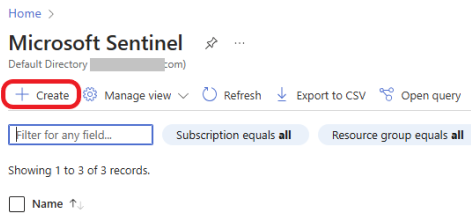
Click on + Create.
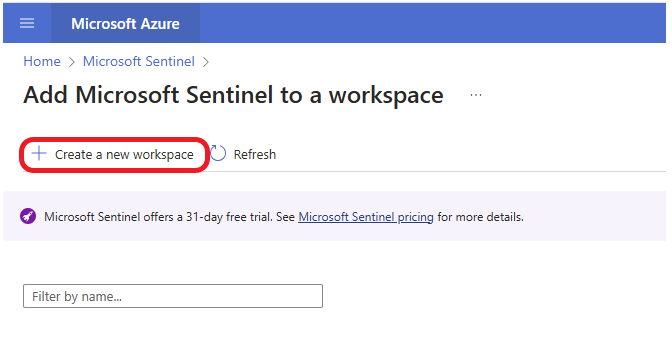
Click on + Create a new workspace to create a new Log Analytics workspace that will store and analyze the log data.
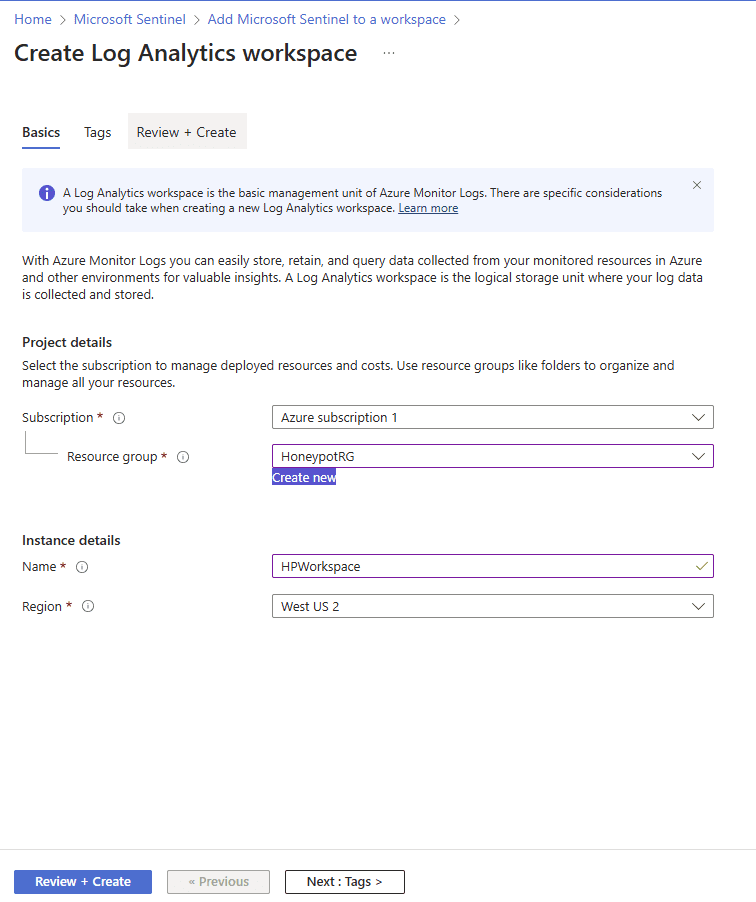
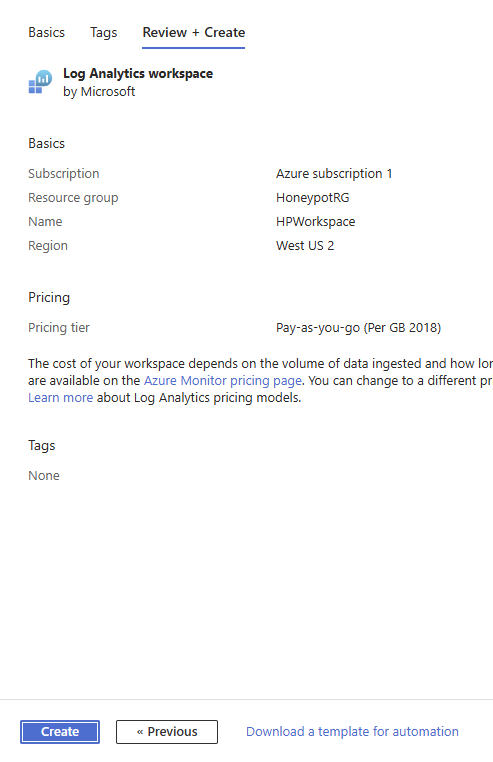
Select your subscription, select your Honeypot Resource group, name your workspace, and select the region where your HoneypotVM is located. Click on Review + Create.
Review and click on the Create button.
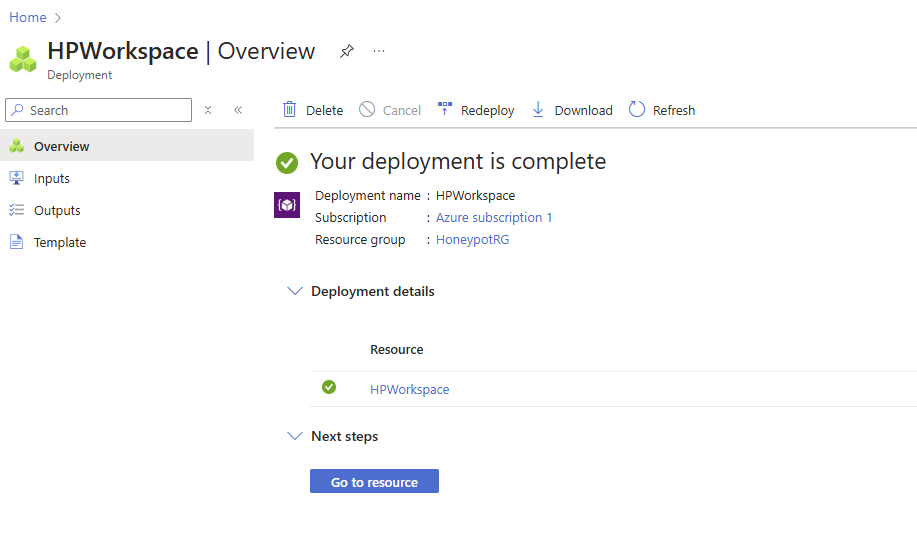
The workspace was deployed successfully.
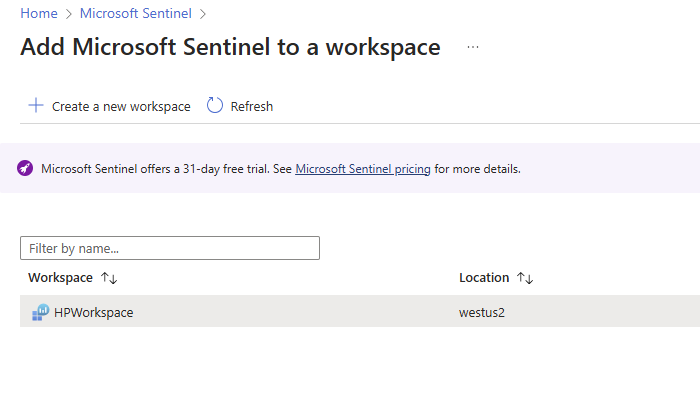
In the Microsoft Sentinel dashboard, click on + Create.

You should see the newly deployed workspace available. Select the workspace you want to add and click on the Add button.
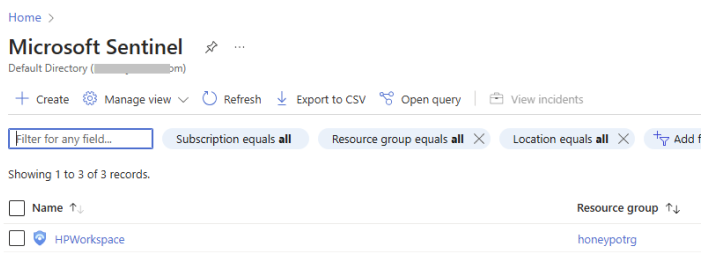
The workspace was added successfully, as shown below.
Connect Azure Virtual Machines to Sentinel
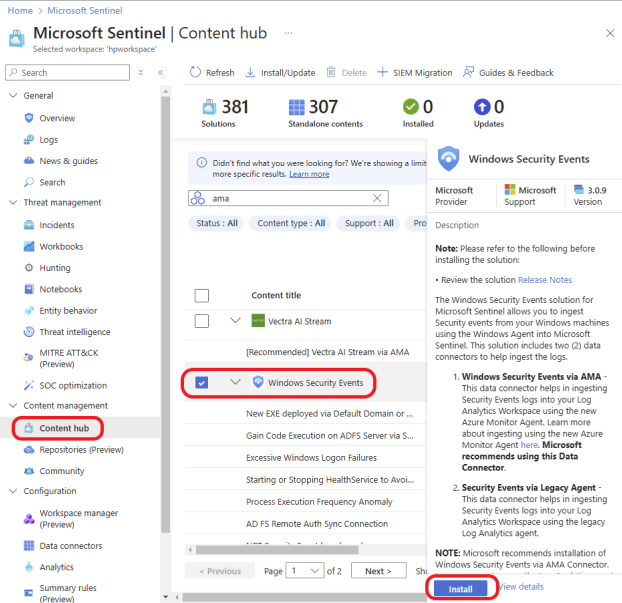
In Microsoft Sentinel, click Content hub on the left menu under Content management, as shown in the screenshot below.
Search for and select Windows Security Events via AMA. Click on the Install button to install it.
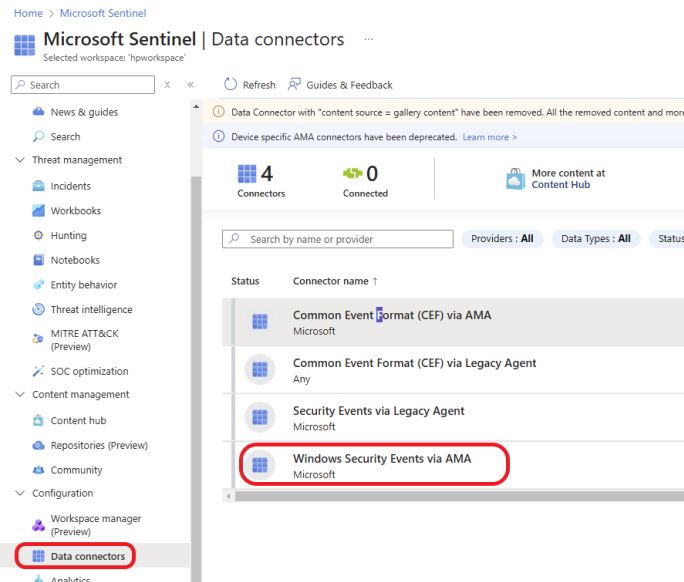
In Microsoft Sentinel, Click Data connectors on the left menu under Configuration, as shown in the screenshot below.
Click on Windows Security Events via AMA.
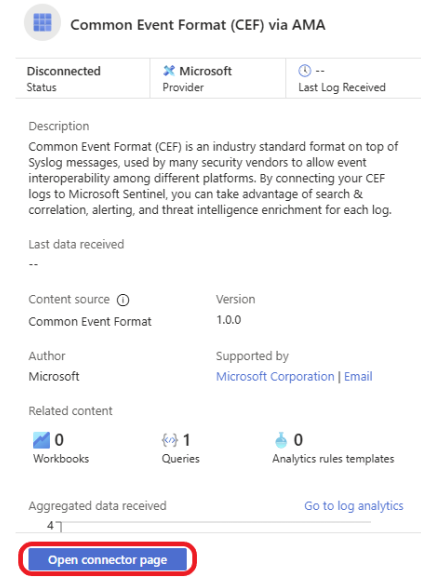
Click on Open connector page.
Click on + Create data collection rule.
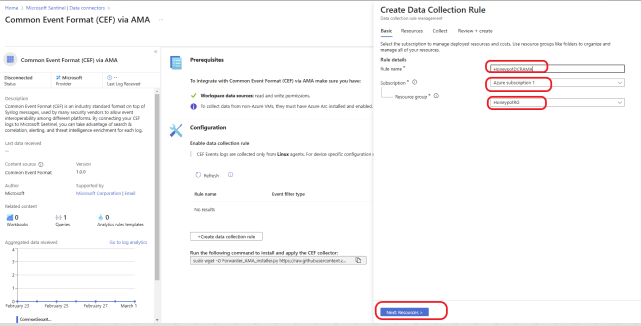
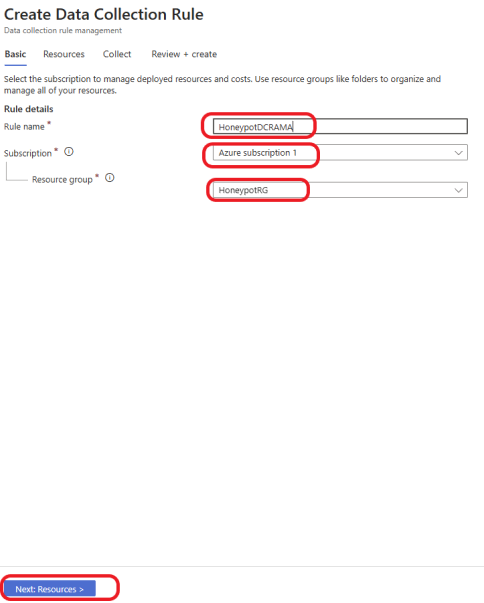
On the Basic tab, name your data connection rule. Select your Subscription and select your Resource group. Click on Next: Resources >
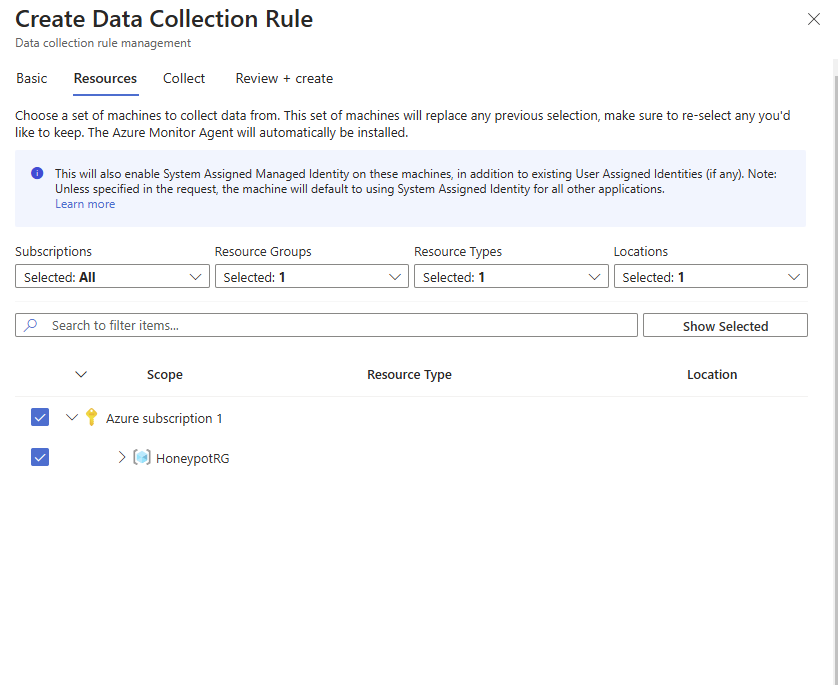
Select your Honeypot resource group, as shown below, and click on Next: Collect >
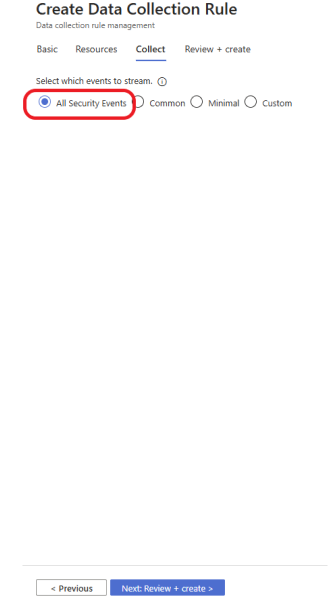
Select based on what events you would like to collect. For this example, I will select All Security Events. Click Next: Review + create >
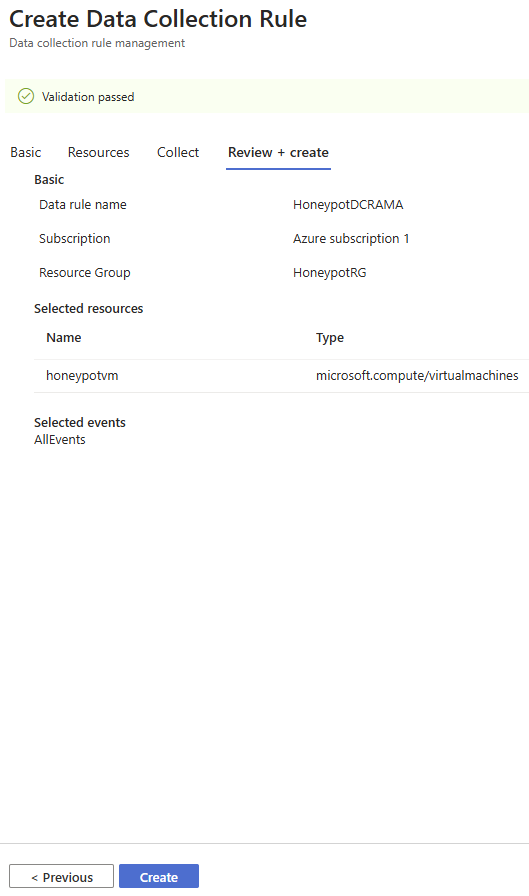
Review your data collection rule and click on the Create button.
Run Queries and Schedule Alert Rules in Microsoft Sentinel
Microsoft Sentinel uses Kusto Query Language (KQL) to write query filters and retrieve event logs from a variety of sources, including security logs, system logs, and other telemetry data. KQL is a powerful query language designed for fast and efficient querying of large datasets, which is essential for analyzing and detecting security threats in Microsoft Sentinel.
With KQL, you can:
- Filter logs based on specific conditions (such as event IDs, time ranges, or log sources).
- Aggregate data to identify patterns or anomalies.
- Join data from different tables to correlate events.
- Create custom dashboards, alerts, and reports.
Next, we are going to run some queries and then schedule them to run every 10 minutes to generate alerts and create incidents if specific conditions are met. Copy the query below and paste it into Sentinel to create a new query.
SecurityEvent
| where EventID == 4625
Explanation
where EventID == 4625: This filter condition is used to select events where theEventIDis 4625.SecurityEvent: This refers to the log or table where security-related events, such as logins, logoff attempts, and other security-related activities in the system, are stored.|: This is a pipe symbol used to chain multiple operations or filters together in KQL.
Event ID 4625 corresponds to a failed login attempt in Windows security logs. So, this query retrieves all failed login attempts from the security event logs within the time range specified at the top.
The query works as expected, so it’s time to schedule it. Click on + New alert rule, as shown below. Then select Create Microsoft Sentinel alert.

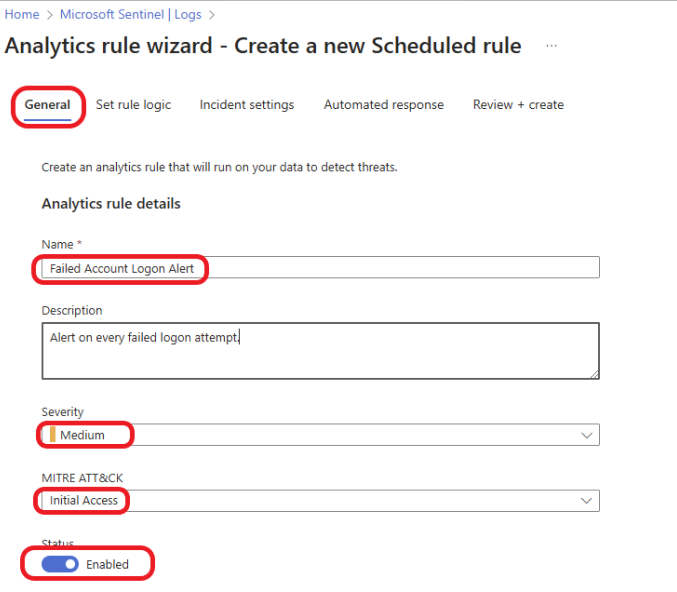
Give your rule a descriptive name and a description (optional), and set the severity based on your organization’s needs. For this example, I will select Medium. Select Initial Access and switch the Status to Enable.
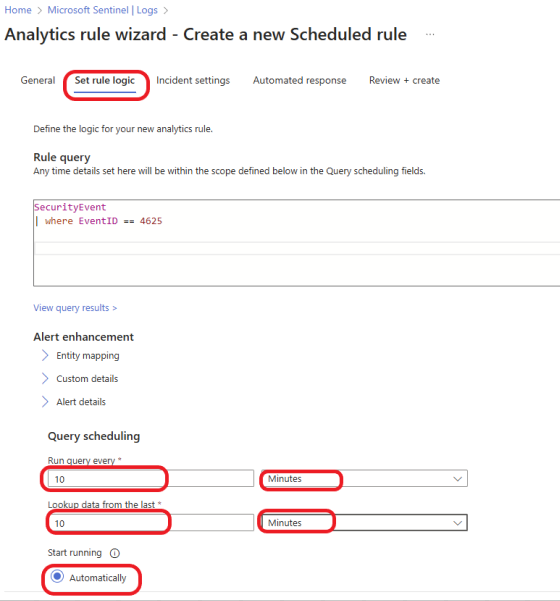
Click on the Set rule logic tab, and specify how often you want the query to run. Again, this will be based on your organization’s needs. For this example, I will set the query to run every 10 minutes and look up data from the last 10 minutes. We want the query to run automatically, so select Automatically and leave everything else as default. Click on Review + Create.
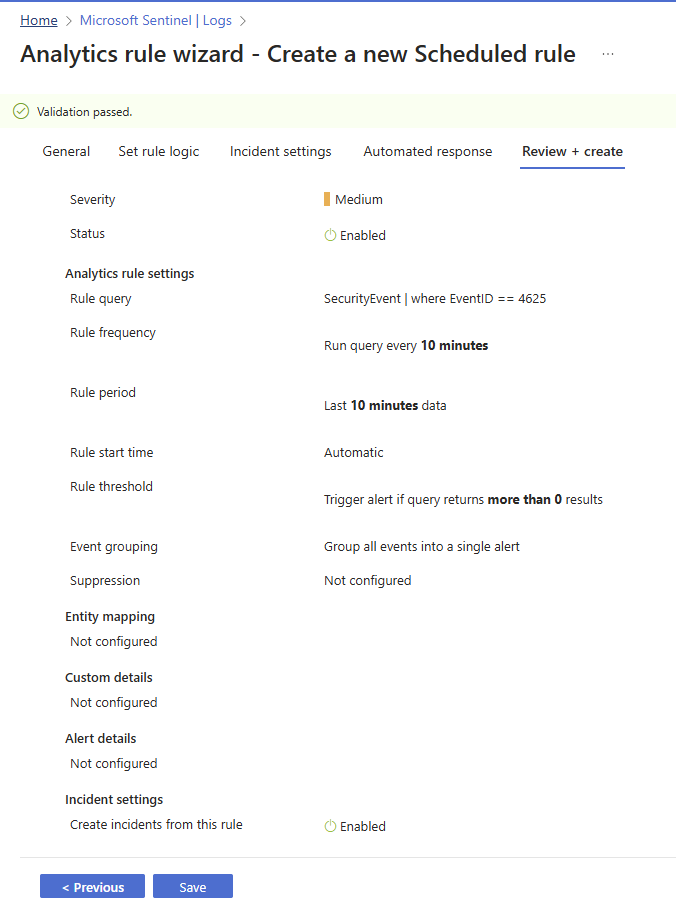
Review the rule and click on the Save button to save the rule.
Let’s schedule the second query. Copy the query below and paste it into Sentinel to create a second rule.
SecurityEvent
| where Activity contains "success" and Account !contains "system"
Explanation
- SecurityEvent: This specifies the data table that stores security event logs, including activities like logins, logoffs, and system events.
- |: The pipe operator is used to chain commands together in KQL.
- where Activity contains “success”: This filters the results to include only those logs where the Activity field contains the word “success”. This typically refers to events where an action (like a login attempt) was successful.
- and: The logical operator used to combine multiple conditions.
- Account !contains “system”: This condition excludes any logs where the Account field contains the word “system”. This is typically used to filter out system accounts and focus only on user accounts.
The query retrieves security events where the Activity indicates success (such as successful logins or other successful actions) and the Account is not a system account (i.e., it excludes events related to system accounts). This helps us monitor successful login attempts or other successful activities by user accounts, excluding system-generated activities.
Click on the +New alert rule, as shown below, to create a new alert rule.
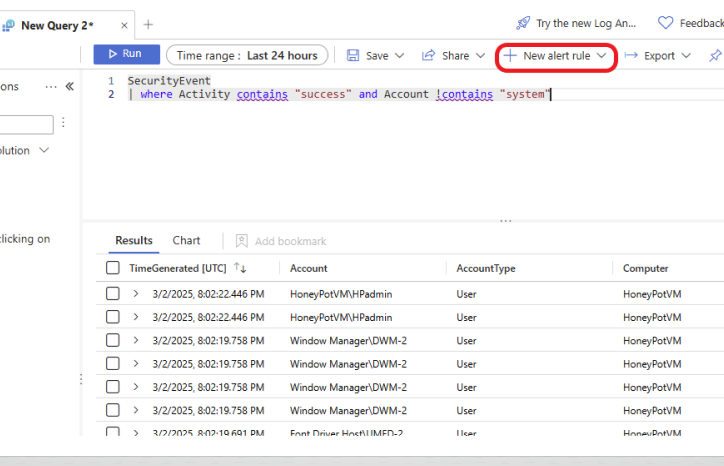
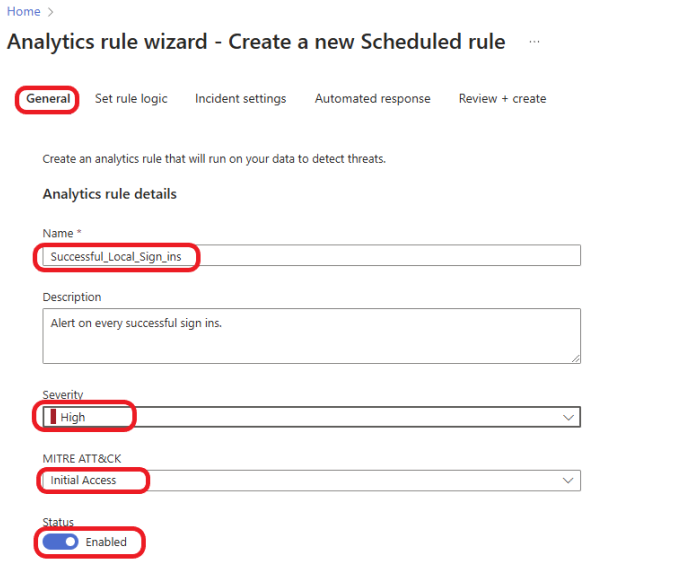
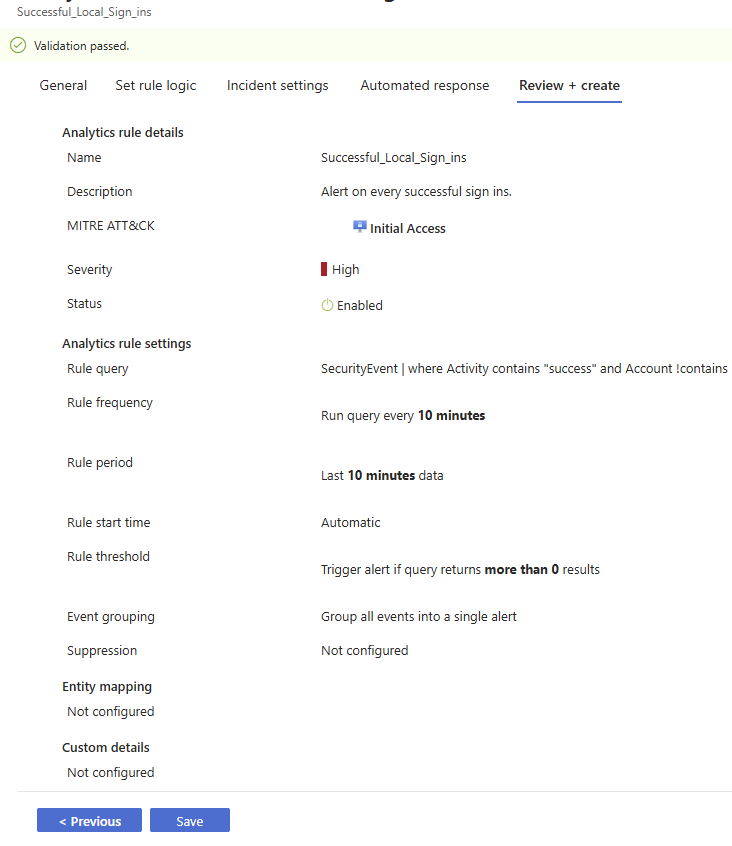
To schedule the second query to run automatically, click on the + New alert rule, then select Create Microsoft Sentinel alert. On the General tab, give your rule a meaningful name and description (optional). Decide what you would like the severity to be, depending on your organization’s risk tolerance. For this example, I will set the severity to High. Select Initial Access and switch the status to Enable to enable the rule.
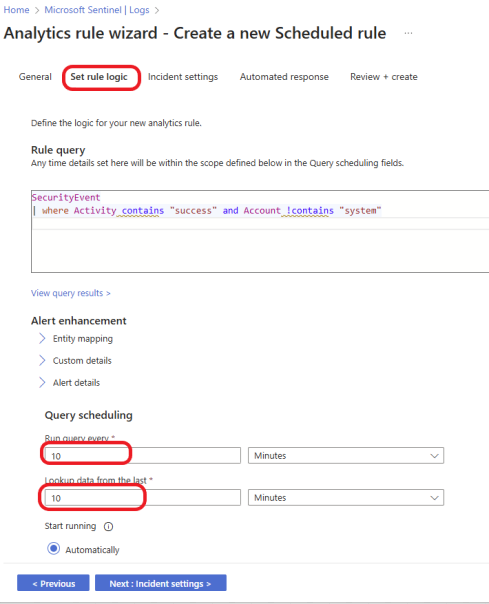
Click on the Set rule logic tab. Decide how often you want the query to run. For this example, I want the query to run every 10 minutes, look up data from the last 10 minutes, and start running automatically.
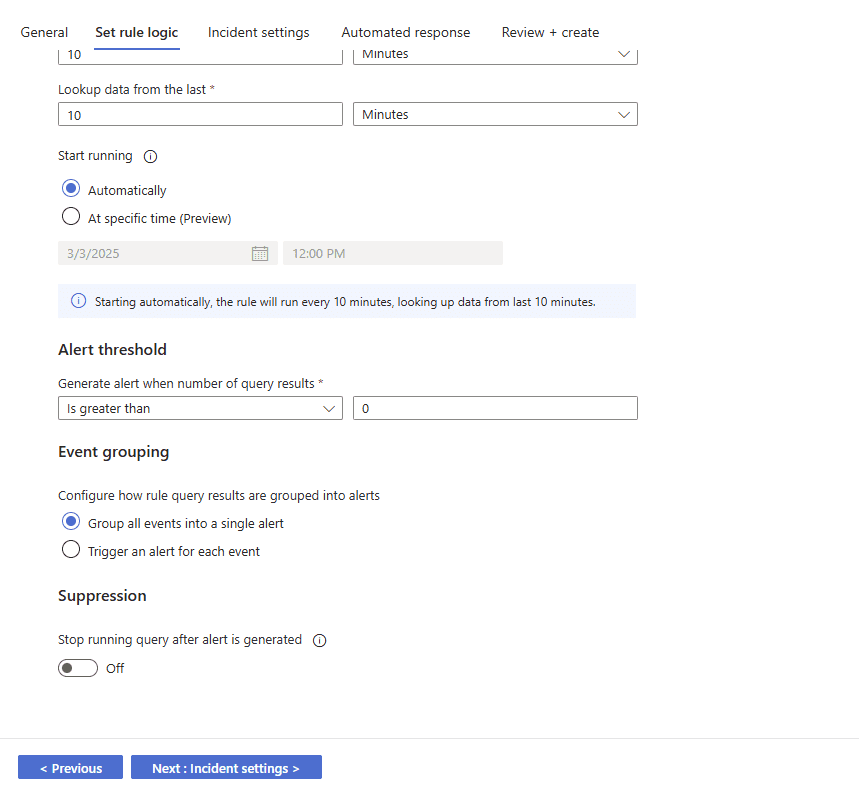
Generate an alert when the number of query results is greater than 0. Under the Event grouping, select Group all events into a single alert.
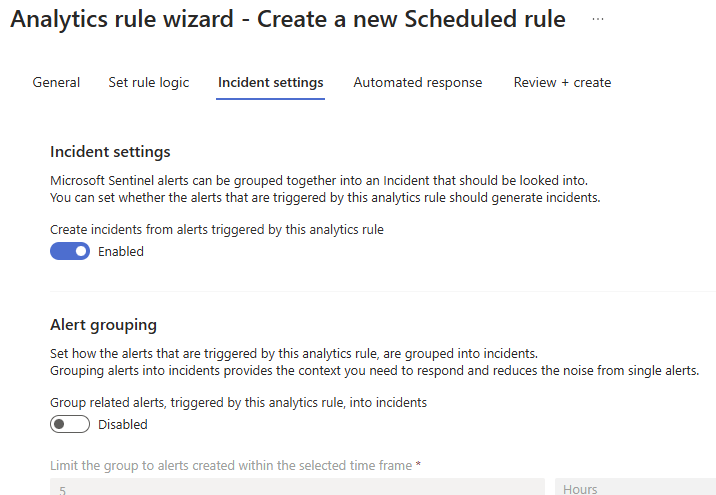
Click on Review + create.
Review your rule and click on the Save button to save the rule.
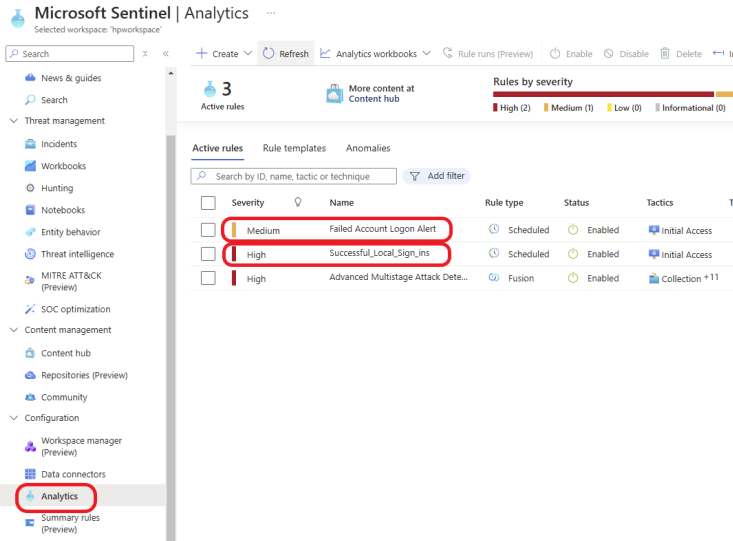
Click on Analytics and click on Refresh. You should see your rules listed.
I left my honeypot running for about 20 hours, and 27 Incidents were created by Sentinel. Click here to learn how to analyze and respond to a brute-force attack from the honeypot in Microsoft Sentinel.

Conclusion
Creating a honeypot in Microsoft Azure and integrating it with Microsoft Sentinel is a powerful method for actively monitoring attacker activity, improving threat detection, and strengthening your overall cybersecurity posture. By setting up a honeypot and leveraging Sentinel’s advanced analytics and automation, you can stay ahead of potential threats and gain actionable insights into attacker behavior.
