Table Of Contents
Splunk Enterprise
Splunk Enterprise is a Security Information & Event Management SIEM solution that allows you to manage your data in one place. By providing a user-friendly dashboard to collect, analyze, visualize, and manage your data. Click here to learn how to install Splunk Enterprise on Windows. Click here to learn How to Install a Windows Universal Forwarder.
The Splunk Search App
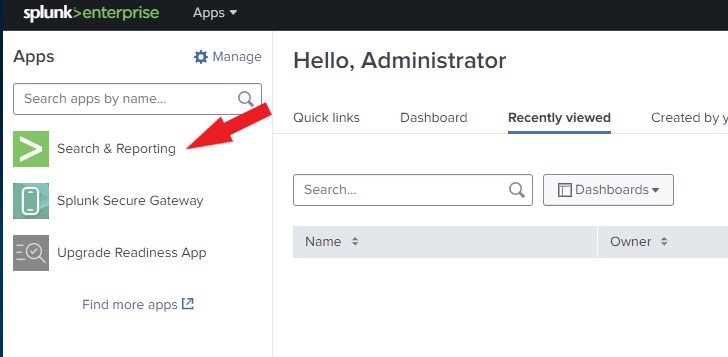
The Search app is the Search & Reporting app. This application allows you to search, analyze, and create reports on your data. Let’s open the Search App. To do this, click the Search & Reporting in the Apps panel from Splunk Home.
The Data Summary
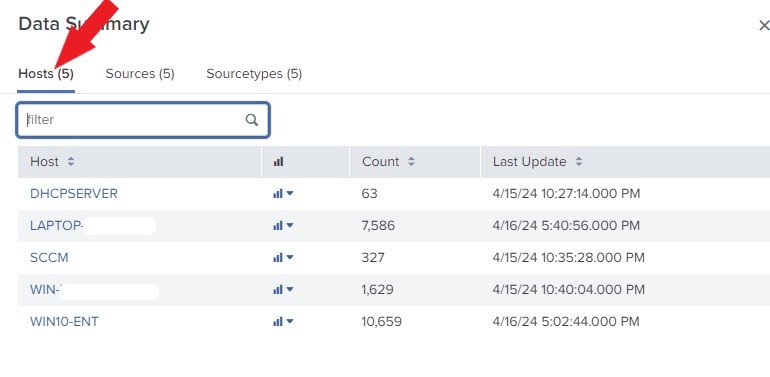
Click on Data Summary. Here, you will see three tabs: Hosts, Sources, and Sourcetypes. These tabs are the searchable fields in your data.

The Hosts
Click on Hosts. The Host of an event identifies the network machine from which the event is generated. It represents the IP address, hostname, or fully qualified domain name. The host field enables you to search data from specific machines.
The Sources
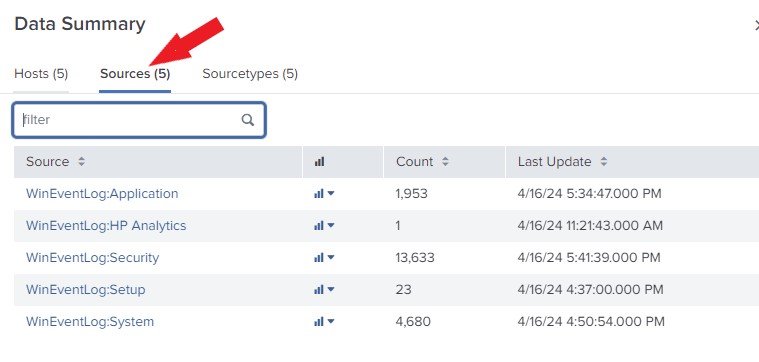
Click on Sources. The source of an event refers to the directory path or file, network port, or script from which the event was created.
The Source type
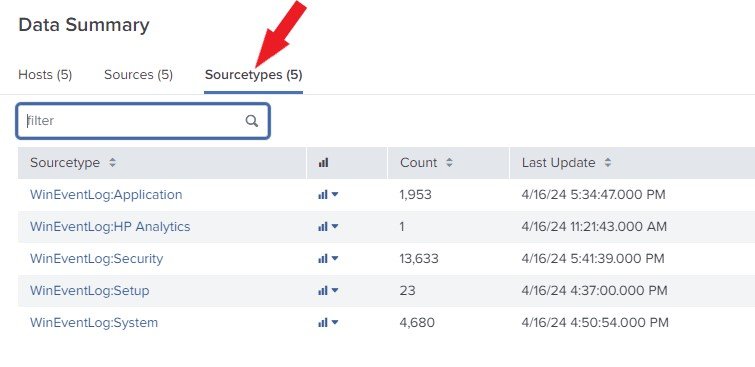
Click on Sourcetype. The source type of an event shows the kind of data it is. This is usually based on how the data is structured. This data organization allows you to search across multiple hosts and sources for the same type of data.
Click the Search & Reporting in the Apps panel from Splunk Home.

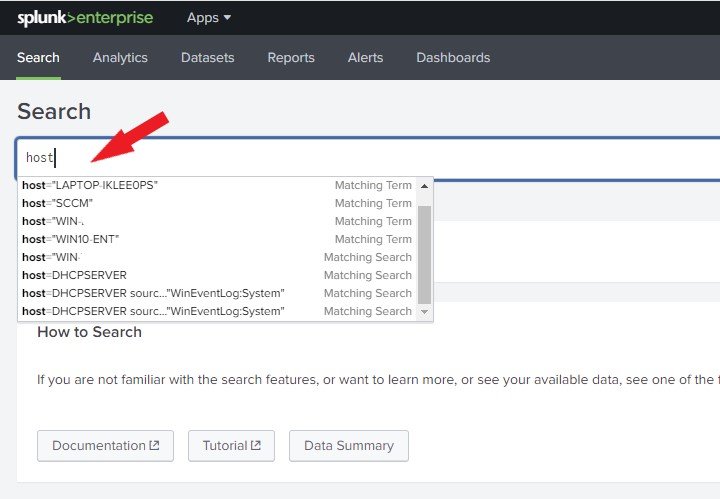
Click the Search tab. In the search box, start by typing host. Select the machine from which you want to view logs and press enter. For this example, I am choosing “WIN10 ENT“
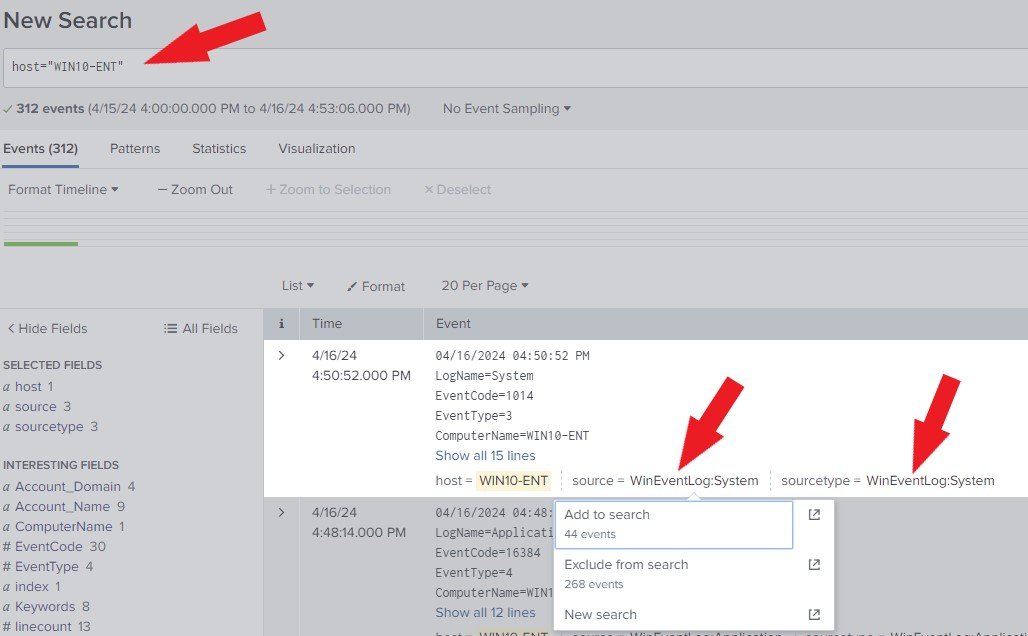
We will analyze the logs from Source = WinEventLog: System and Sourcetype = WinEventLog: System. Left-click Source = WinEventLog: System and click Add to Search. Next, Left-click Sourcetype = WinEventLog: System and click Add to Search. You can click Exclude from Serch if you want it to be excluded from the search (Optional).
The Search Assistant has generated the search language for easy search, as shown below.
host="WIN10-ENT" source="WinEventLog:Security" sourcetype="WinEventLog:Security"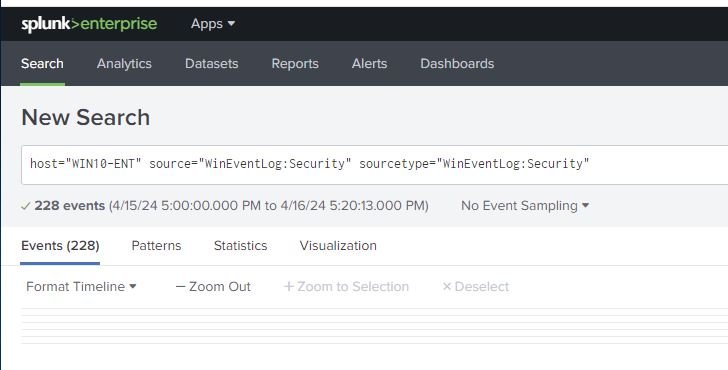
Understanding the Search view
The Search view appears when you click the Search tab for a new search or after you run a search. It has many components such as the Search bar, Save As, App bar, Time range picker, search mode selector, search action buttons, counts of events, Visualizations, job status bar, Patterns, Statistics, and tabs for Events, as shown below.
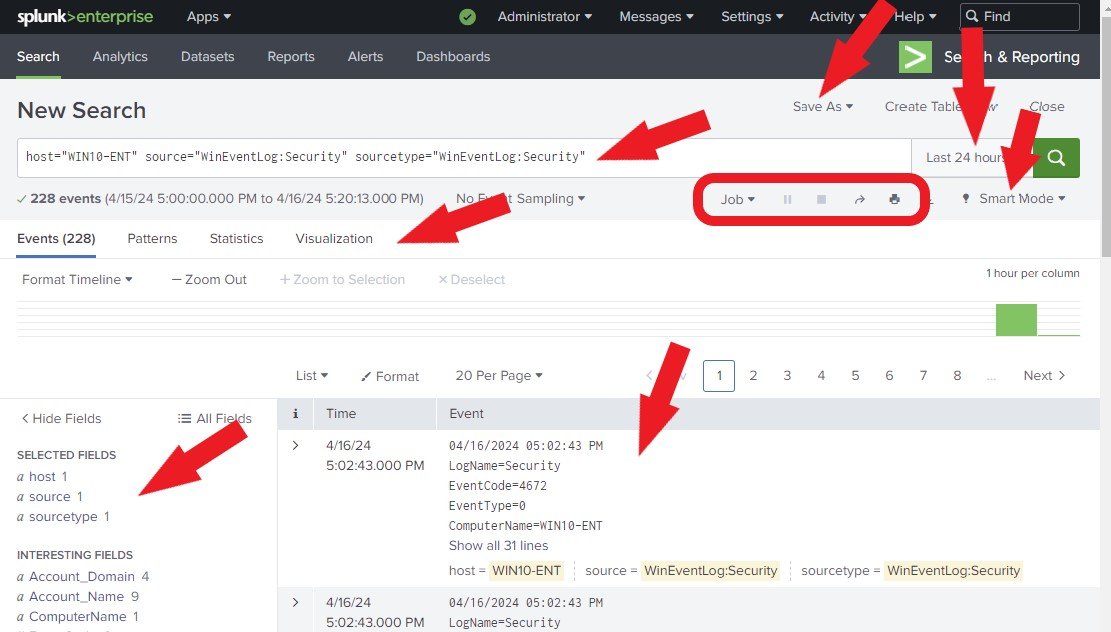
Search bar: This is where you define your search criteria
Save As: Allows you to save your search results as a Report, Alert, Existing Dashboard, New Dashboard, or Event Type.
Time range picker: Allows you to specify the search period, For example, last 24 hours.
The Search mode selector: The search mode selector allows you to choose a search experience based on your needs. There are 3 search modes: Smart (default), Fast, and Verbose.
Events: Allows you to view the events that match your search criteria.
Search by category
You can search by category using the asterisk ( * ). In the search box, type “*category” and press enter.
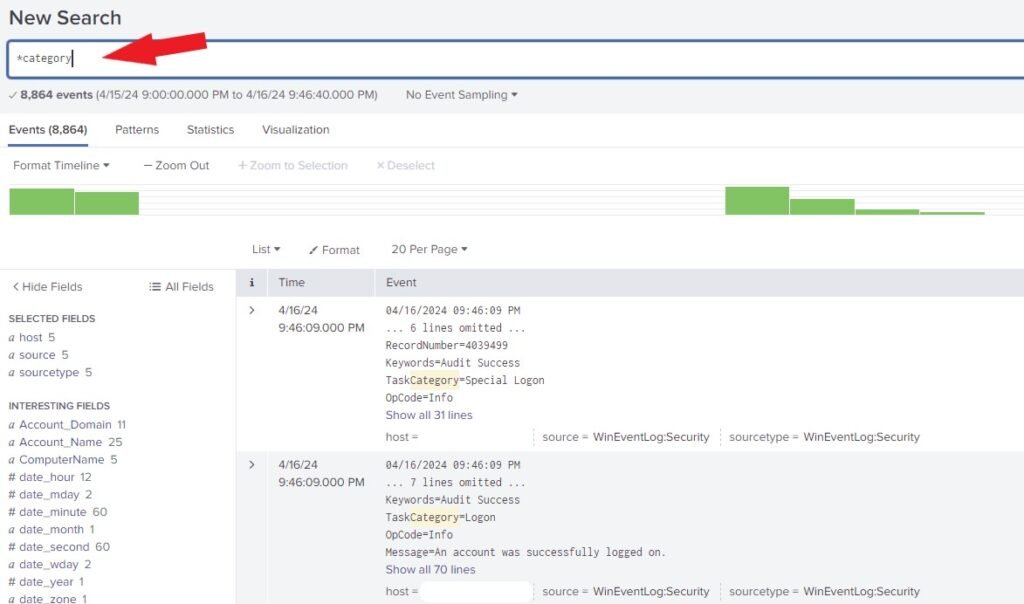
Now, left-click the Logon and click Add to search. As shown below.
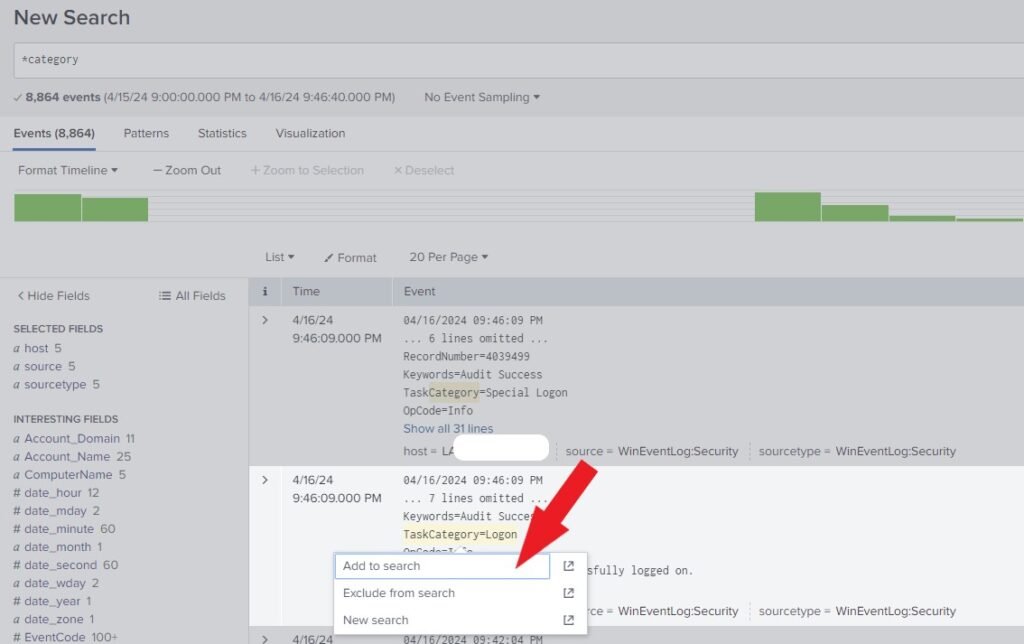
Notice that the Search Assistant has generated the search language for easy search, as shown below. This will generate all the event logs related to Logon within the specified time.
*category "TaskCategory=Logon"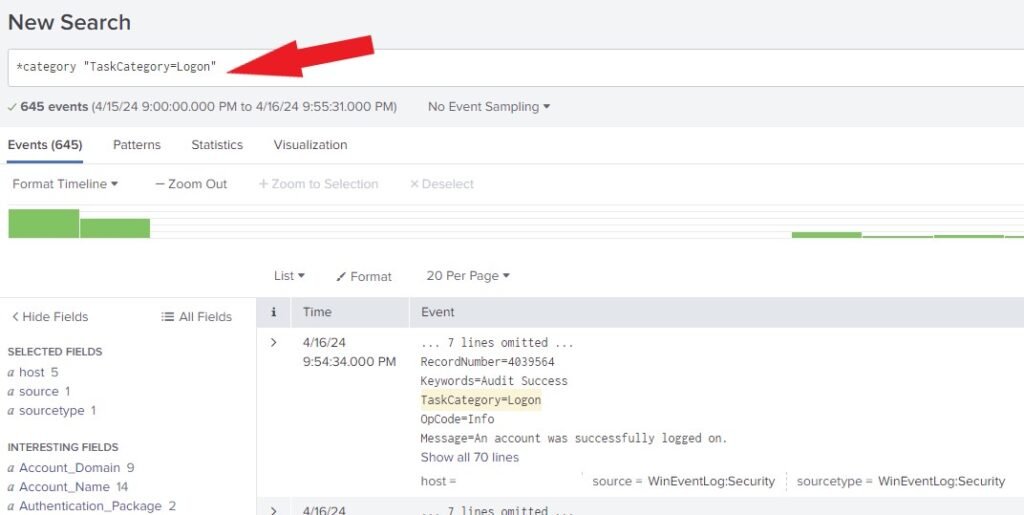
Next, let’s search using the hostname and category.
In the search box, start by typing host. Select the machine you want to view logs from and press enter. For this example, I am choosing “WIN10 ENT“. Then type “*category” and press enter. Click on Logon and click on Add to search.
Notice that the Search Assistant has generated the search language for us to make the search easy. As shown below. This will generate all the event logs related to Logon for the “WIN10 ENT” machine.
host="WIN10-ENT"*category "TaskCategory=Logon"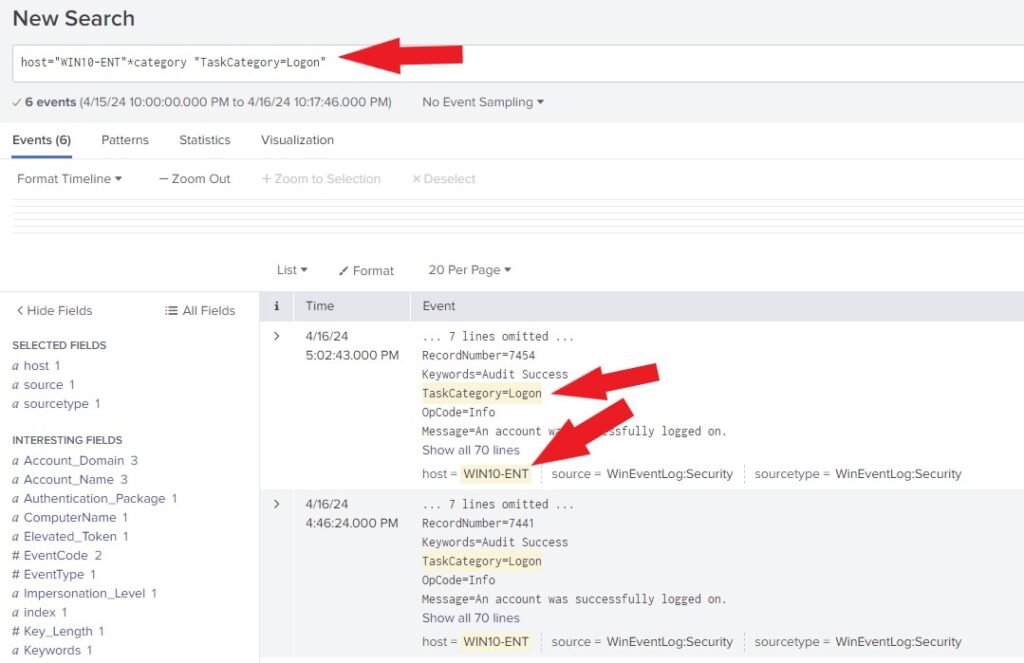
Best Practices for Searching Data in Splunk
Here are some best practices to keep in mind while searching data in Splunk using the Splunk Search App:
- Start with a Narrow Search: Begin your search with a narrow scope to minimize the amount of data processed and improve search performance. Refine your search gradually by adding additional search conditions.
- Utilize Field Indexing: Configure field extraction and indexing for frequently searched fields. This improves search performance and allows for more efficient filtering and analysis.
- Use Search Filters: Leverage search filters to exclude irrelevant data or focus on specific data sources. This helps reduce noise and improves the accuracy of the search results.
- Optimize Search Queries: Regularly review and optimize your search queries to ensure they are efficient and effective. Avoid unnecessary search conditions or complex search operations that can impact performance.
- Learn and Explore: Familiarize yourself with the Splunk Search Processing Language (SPL) and explore the various search commands and functions available. This allows you to leverage the full power of Splunk’s search capabilities.
Conclusion
The Splunk Search App is a valuable tool for searching and analyzing data in Splunk. By following the steps outlined in this blog post and implementing best practices, you can effectively search and retrieve relevant data from your Splunk indexes. Remember to refine your search queries, leverage search modifiers and filters, and explore the various features provided by Splunk to gain valuable insights from your data.
References
Splunk Documentation Start Searching
